The TimesSquare Quality Mid Cap Growth ETF seeks long-term capital appreciation by investing primarily in a diversified portfolio of U.S. equity securities of mid-capitalization companies that exhibit strong growth potential and high-quality characteristics.
The Fund is actively managed to provide targeted exposure to the U.S. mid-cap growth market. TimesSquare applies a bottom-up, research-driven approach to identify companies that demonstrate:
Sustainable competitive advantages
Strong and capable management teams
Consistent growth and meaningful earnings potential
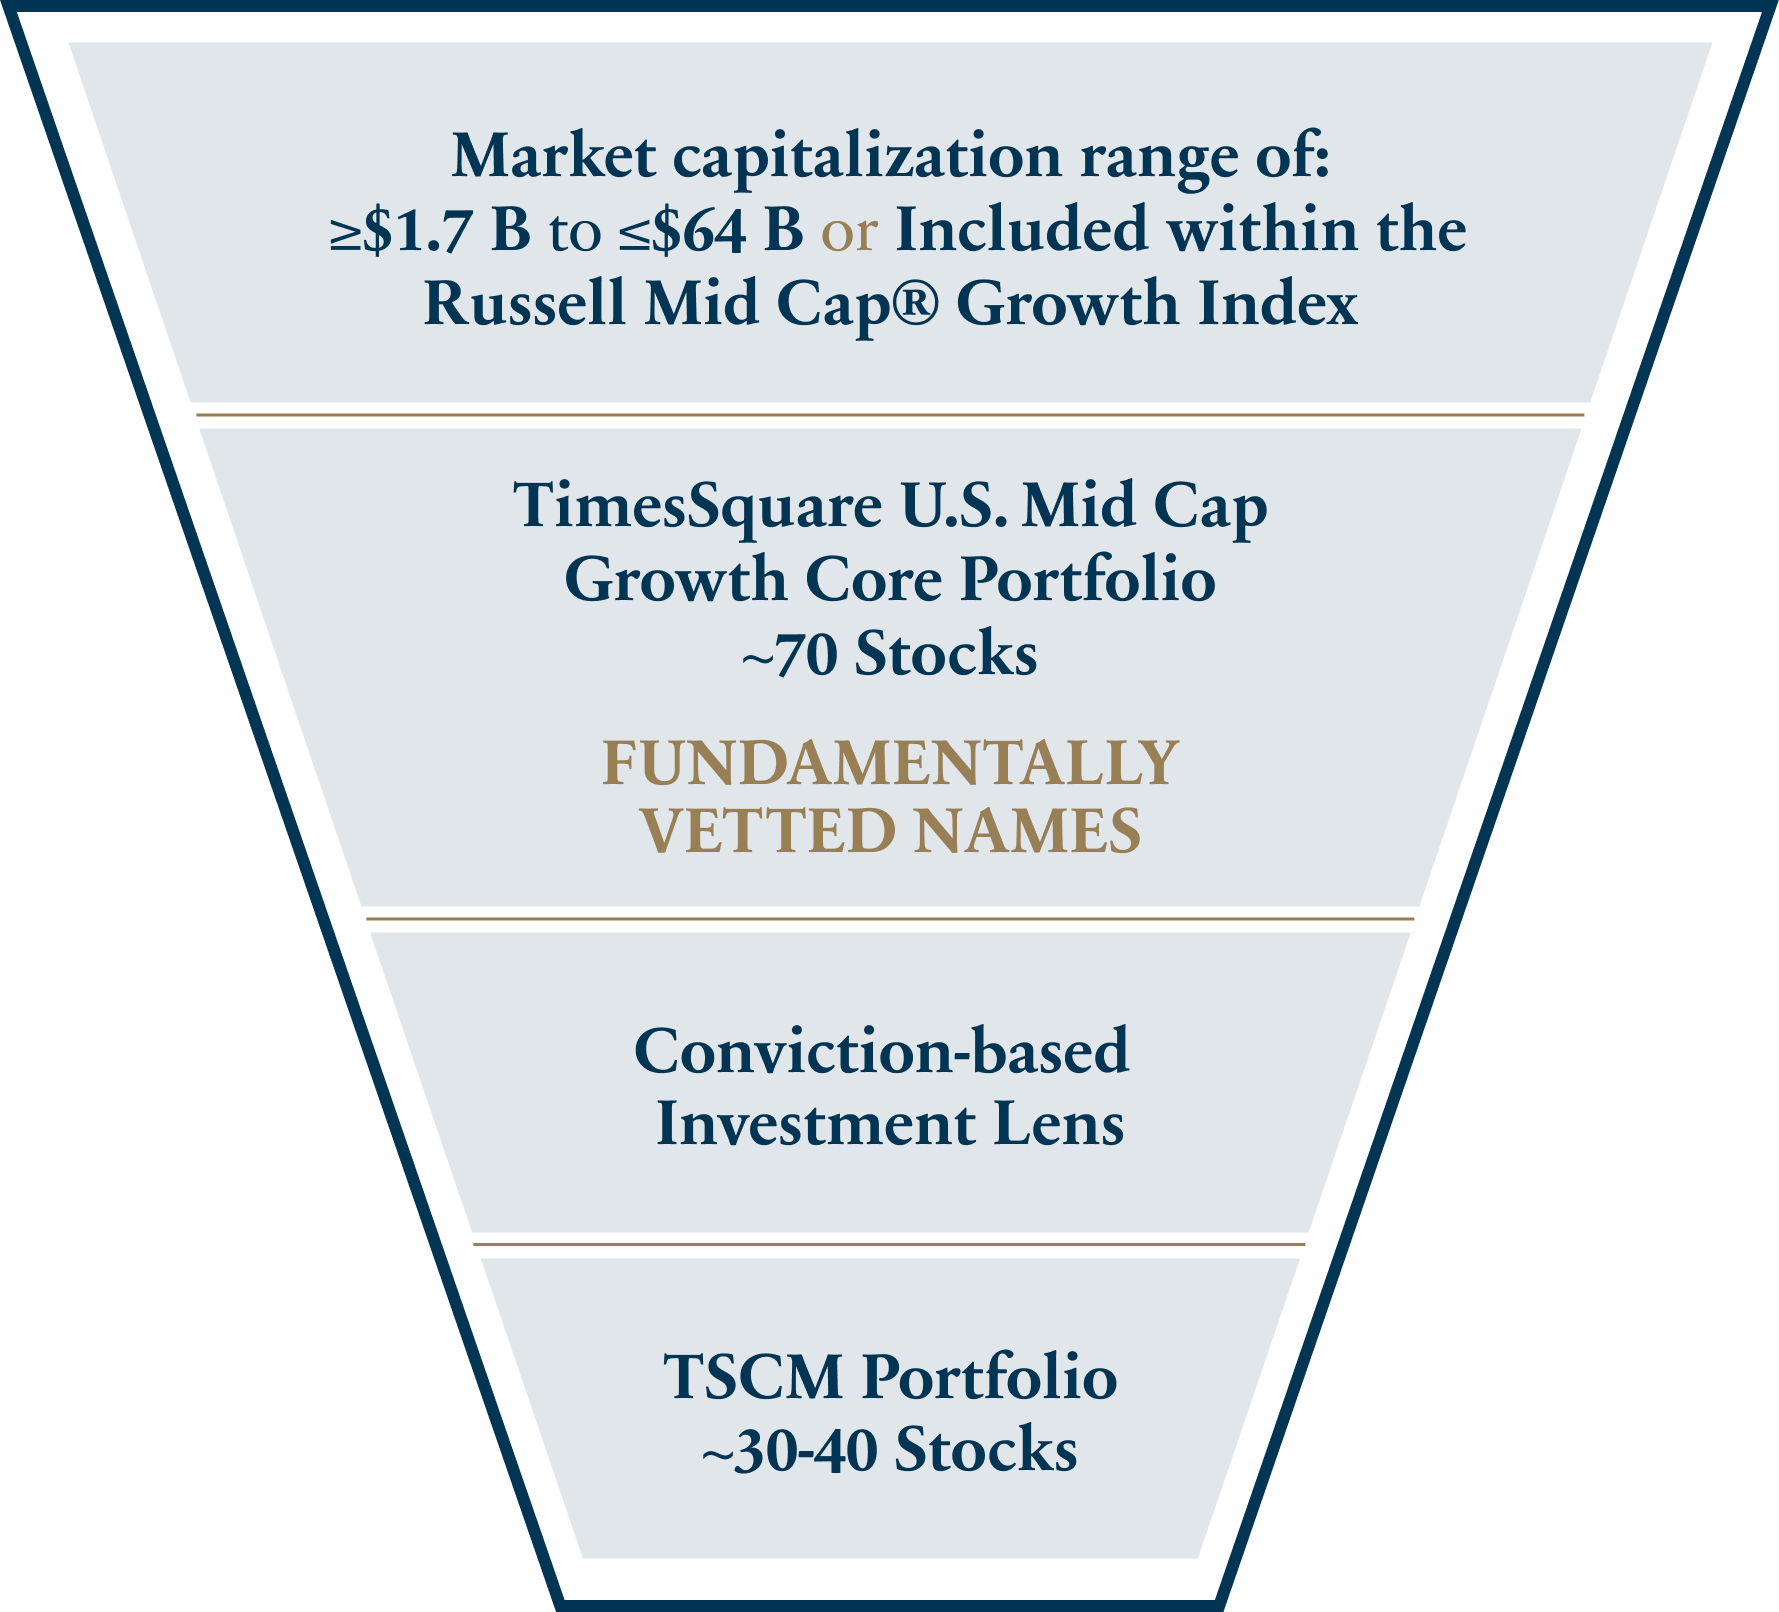
The Fund defines “mid-capitalization companies” as those within the market capitalization range of the Russell Midcap® Growth Index. TimesSquare may continue to hold securities that move outside this range if doing so aligns with the Fund’s investment objectives.
By maintaining a disciplined focus on quality, growth, and diversification, the TimesSquare Quality Mid Cap Growth ETF aims to deliver attractive long-term returns while managing risk through a structured, team-based investment process.
Fund Characteristics
Fund Details
Inception Date
12/29/2025
Asset Class
Dividends Frequency
Exchange
Nasdaq
CUSIP
900934837
Benchmarks
Expense Ratio
0.55%
*The subsidized SEC yield is calculated with a standardized formula mandated by the SEC. The formula is based on maximum offering price per share and includes the effect of any fee waivers. Without waivers, yields would be reduced. This is also referred to as the “standardized yield,” “30-Day Yield” and “Current Yield”.
Net Assets
$8.07M
NAV
$20.18
Shares Outstanding
400001
Premium/Discount Percentage
0.07%
Closing Price
$20.19
Median 30 Day Spread*
0.20%
*30-Day Median Spread is a calculation of Fund’s median bid-ask spread, expressed as a percentage rounded to the nearest hundredth, computed by: identifying the Fund’s national best bid and national best offer as of the end of each 10 second interval during each trading day of the last 30 calendar days; dividing the difference between each such bid and offer by the midpoint of the national best bid and national best offer; and identifying the median of those values.
Performance
As of: XX/XX/XXXX
Inception Date: 12/29/2025
Fund Ticker
1MO
3MO
YTD
1YR
3YR
5YR
10YR
INCEPTION
TSCM MKT
-
-
-
-
-
-
-
-
TSCM NAV
-
-
-
-
-
-
-
-
As of: XX/XX/XXXX
Inception Date: 12/29/2025
Fund Ticker
1MO
3MO
YTD
1YR
3YR
5YR
10YR
INCEPTION
TSCM MKT
-
-
-
-
-
-
-
-
TSCM NAV
-
-
-
-
-
-
-
-
The performance data quoted represents past performance and is no guarantee of future results. Investment return and principal value of an investment will fluctuate so that an investors shares, when redeemed, may be worth more or less than their original cost. Current performance may be lower or higher than the performance data quoted. For the most recent month-end performance, please call (888) ETF-TSCM.
Short term performance, in particular, is not a good indication of the funds future performance, and an investment should not be made based solely on returns. Market price is the price at which shares in the ETF can be bought or sold on the exchanges during trading hours, while the net asset value (NAV) represents the value of each shares portion of the funds underlying assets and cash at the end of the trading day.
The Fund (TSCM) is available through various channels including via phone (888) ETF-TSCM, broker-dealers, investment advisers, and other financial services firms, including:
This quarter, we focus our perspective on the Information Technology sector and the drivers behind why it remains fundamentally robust and how the dynamics of value creation are changing.
Sonu is a Partner and Portfolio Manager/Analyst on TimesSquare’s U.S. equity team. She is responsible for research coverage of Software and Technology Services. Sonu joined TimesSquare in August 2018 from Pine River Capital Management, a multi-strategy hedge fund where she was a Senior Analyst covering TMT sectors across Software, Internet, Services, Hardware and Telecom. Her previous research analyst experiences were as a Senior TMT Analyst at Surveyor Capital platform of Citadel and an Analyst at Fred Alger Management. Sonu has an M.S. in Mathematics and Computer Science from Indian Institute of Technology, Delhi and an M.B.A from Kellogg School of Management at Northwestern University. She is a member of the CFA Institute and the CFA Society New York. Sonu is conversational in Hindi.
Edward F. Salib, Portfolio Manager
23 Years of Experience | 23 Years at TimesSquare
Ed is a Partner and Portfolio Manager/Analyst on TimesSquare’s U.S. equity team and is responsible for research coverage of Consumer Discretionary & Staples, Media, and related services. Ed joined the firm in 2002 as a Research Associate and had provided analytical support to the research analysts through the development of financial models and databases. He graduated with a B.S. in Applied Economics & Management from Cornell University.
Joshua A. Bischoff, Portfolio Manager
30 Years of Experience | 22 Years at TimesSquare
Joshua is a Partner and Head of Trading at TimesSquare. He is also a member of the Management Committee that oversees TimesSquare. Joshua joined TimesSquare in 2003 from Loomis Sayles & Co. where he held a similar position. His previous experience includes trading for small capitalization equity products at Scudder Kemper and Dreman Value and working as a block trader for Bear Stearns where he concentrated on trading financial and energy stocks. Joshua has a B.S. in Business Administration from Providence College and holds FINRA Series 7, 63 and 57 licenses.