
The Mid Cap Advantage: How Active Management Can Augment the Market’s Most Consistent Growth Engine
Edward Salib
Portfolio Manager & Analyst
Consumer Discretionary & Staples, Media, and related services.

Sonu Chawla, CFA
Portfolio Manager & Analyst<
Software & Technology Services
TSCM Mid Cap Approach:
Avoiding benchmark concentration and momentum-driven distortions
Identifying companies experiencing meaningful but underrecognized improvements
Emphasizing secular growth drivers over short-term market themes
As long-time U.S. public equity investors we view mid capitalization companies as an attractive balance between large caps and small caps. These companies have matured into a growth phase that is often more stable than when they were small caps, though with higher incremental growth than large caps. The return and risk data over the last 25 years bears that out:
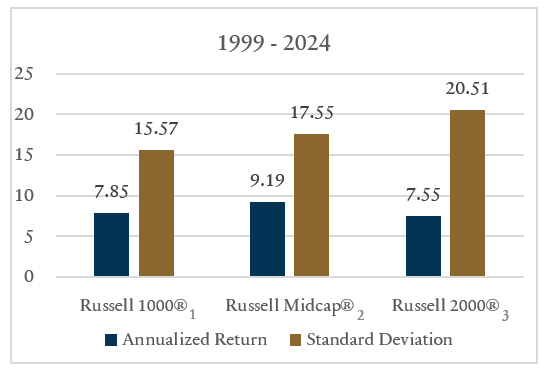
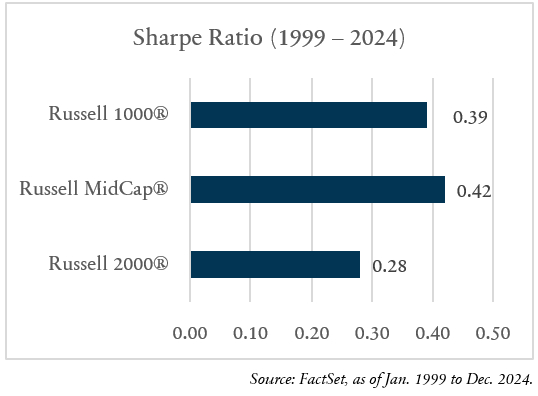
In addition, when reviewing five-year monthly rolling performance over that same 25-year period:
- Mid outperformed large 57% of the time (by an average of 373 basis points)
- Mid outperformed small 92% of the time (by an average of 199 basis points)
Are the Mid Cap Goal Posts Moving?
By FTSE Russell’s definition, the widely used Russell Midcap Index always begins with 800 stocks and allows for proportionate weighting of those names into the Growth⁴ and Value⁵ indexes. Typically, both Growth and Value have over 400 names each. However, with the more recent trend of market cap expansion / capital moving into Growth stocks, the dynamics for the Russell Midcap Growth, Value, and overall Index have changed.
Fewer, Larger Growth Names
Because FTSE Russell balances the capital between growth and value, fewer names are needed to populate the Growth Index. As the Russell Midcap Growth Index has become more top heavy, it now includes fewer stocks than ever. The index has fewer than 300 companies (280 as of 11/30/25 to be exact) for the first time on record, down from a high of 552 in 2015 and 408 just three years ago. Furthermore, this has resulted in greater concentration and total weight in the Russell Midcap Growth’s top ten. Ten years ago, the top ten weight was under 10%, 15% in 2024, and now 21.5% as of September 2025.
Russell Midcap Growth Index
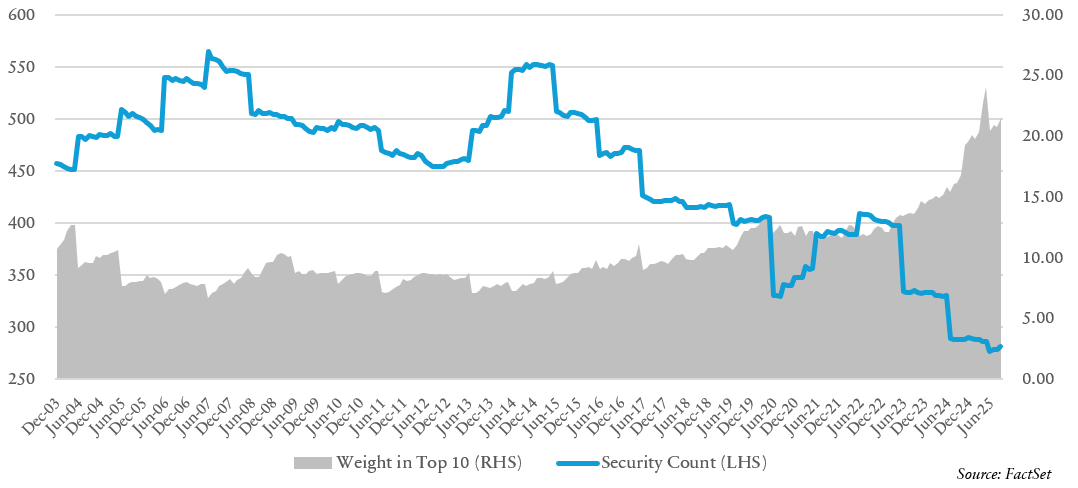
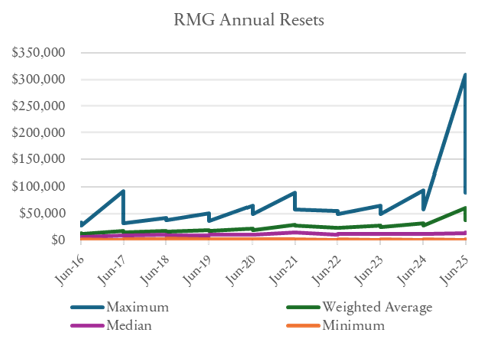
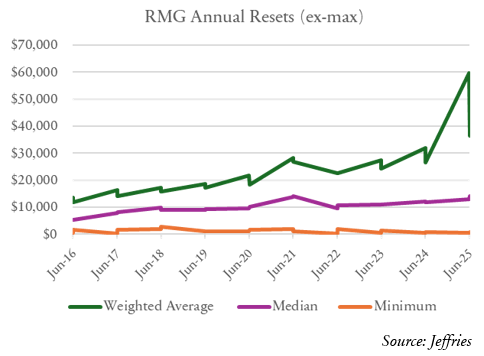
While FTSE Russell reconstitutes its indexes annually (and beginning in 2026, semiannually), in part to “graduate” the larger cap constituents to Russell’s mega cap Top 200 Index⁶, there has been a steady upward trend of the size profile for the Russell Midcap Growth Index:
Sector Exposures are Subject to Rapid Moves
The same mechanistic nature of the index creation and rebalancing that causes those concentration levels also affects the economic sector exposures within the index. Shifts in the index during a rebalance can be dramatic and do not necessarily reflect economic realities or investment opportunities. Take the most recent rebalance in June 2025. Over 1,000 basis points abandoned the Information Technology sector and more than 800 basis points flooded into Consumer Discretionary. It’s not as if the economic landscape or opportunity set changed, but the structure of the index became dramatically different. Russell intends to reconstitute the indexes twice per year beginning in 2026 (once in June and again in November). In our view, this should mitigate some of the magnitude of these significant shifts, but it likely is not the trend.
In summary, the Russell Midcap Growth Index is increasingly concentrated, leading to material shifts in economic exposure, and appears to be drifting away from the historical market cap definition of Mid Cap. This steady increase in size and concentration is likely to continue unabated, which fundamentally changes the essence of Mid Cap when only using the indexes. As a small to mid-cap manager for over 25 years, we believe in offering our clients the exposures they are seeking, and style purity is paramount to maintaining the integrity of our strategy.
The TimesSquare Difference
Being an active manager focused on quality growth businesses, we strive to avoid the hype that attracts capital over short time periods to the biggest index holdings, momentum darlings, or hyper growth names. Passive strategies will blindly mirror these trends. The bigger a name or sector gets in the index, the more capital chases which results in managers benchmark hugging / closet indexing. In contrast, TimesSquare’s fundamental research process involves a thorough bottom-up analysis of companies and how they create economic growth.
Our portfolios are not constructed top down by sector or industry. We take a clean slate approach to building positions and evaluating/revaluating the companies based solely on their merits. We favor differentiated, scaling businesses that are gaining share, demonstrating pricing power, and most importantly, deploying investor capital with a focus on generating returns. Our strategy primarily focuses on secular growth and long-term trends, while some are more cyclically positioned. Overall, we believe our 25-year track record demonstrates a consistent quality bias that endures through varying economic cycles. Since inception, our team has remained disciplined in executing this strategy and pursuing quality growth businesses.
It’s worth reiterating that the way the benchmark is constructed, and growth and value are split, are based on definitions that haven’t changed in decades. As our team evaluates our holdings and seeks out new ideas, we have the freedom to cast a wider net across the landscape of companies, often finding those that don’t fit into the traditional growth or value boxes. These ideas are often overlooked by managers looking solely at the big index weights or the popular theme of the day.
One source of new ideas comes from a reexamination of companies undergoing potentially positive change(s) that the market is not fully appreciating (e.g. upgraded senior management, enhanced strategies/business models, improvements in their end markets). We believe we have the important advantage of sourcing ideas as they “graduate” from the dedicated Small Cap strategies we manage. These names are covered by the same investment team, so there is familiarity and institutional knowledge of these businesses when they have grown to the thresholds to be eligible for Mid Cap. When reviewing our Mid Cap Growth portfolio today, over 20% of current positions were previously held in our Small Cap strategy and are graduates of the selection process. Elevating these small cap names is one manner that refreshes our strategy and stays true to the essence of Mid Caps.
Passive investing in Russell Midcap index strategies increasingly means losing access to the true breadth and depth of companies across the Mid Cap market capitalization range. We argue that our active management and rigorous stock selection helps to provide a more authentic representation of Mid Cap exposure, allowing us to uncover attractive opportunities overlooked by the benchmark. As the index has become significantly larger and more concentrated, the need for this active approach is growing. Since these indexes are the default standard for Mid Cap allocations, their inherent structural risks are often disregarded; therefore, relying on the index alone for distinct Mid Cap exposure may prove insufficient.
Disclosures
1 The Russell 1000® Index measures the performance of the large-cap segment of the US equity universe. The Russell 1000 Index is a subset of the Russell 3000® Index which is designed to represent approximately 98% of the investable US equity market.
2 The Russell Midcap® Index measures the performance of the mid-cap segment of the US equity universe. The Russell Midcap Index is a subset of the Russell 1000® Index.
3 The Russell 2000® Index measures the performance of the small-cap segment of the US equity universe. The Russell 2000 Index is a subset of the Russell 3000® Index which is designed to represent approximately 98% of the investable US equity market.
4 The Russell Midcap® Growth Index measures the performance of the midcap growth segment of the US equity universe. It includes those Russell Midcap Index companies with relatively higher price-to-book ratios, higher I/B/E/S forecast medium term (2 year) growth and higher sales per share historical growth (5 years).
5 The Russell Midcap® Value Index measures the performance of the midcap value segment of the US equity universe. It includes those Russell Midcap Index companies with relatively lower price-to-book ratios, lower I/B/E/S forecast medium term (2 year) growth and lower sales per share historical growth (5 years).
6 The Russell Top 200® Index measures the performance of the largest cap segment of the US equity universe. The Russell Top 200 Index is a subset of the Russell 3000® Index.
This material is for your private information and is provided for educational purposes only. The views expressed are the views of TimesSquare Capital Management, LLC only through the period ending November 2025 and are subject to change based on market and other conditions. The opinions expressed may differ from those with different investment philosophies. The information we provide does not constitute investment advice and it should not be relied on as such. It should not be considered an offer or solicitation to buy or an offer to sell a security. It does not consider any investor’s particular investment objectives, strategies, tax status or investment horizon. We encourage you to consult your tax or financial advisor. All material has been obtained from sources believed to be reliable, but its accuracy is not guaranteed. There is no representation or warranty as to the current accuracy of, nor liability for, decisions based on such information.
TimesSquare Capital Management LLC is a growth equity specialist that is registered as an investment adviser with the U.S. Securities and Exchange Commission and is majority owned by Affiliated Managers Group, Inc. With an experienced investment team and rigorous fundamental analysis, we identify high quality companies with strong management in inefficient market cap ranges. As a boutique, our highly collaborative process and integrated approach promote our commitment to meeting our clients’ service needs. Importantly, employees share a common economic interest through equity participation, aligning them with the success of our clients and the firm.
Certain information contained herein has been obtained from third party sources and such information has not been independently verified by TSCM. No representation, warranty, or undertaking, expressed or implied, is given to the accuracy or completeness of such information by TSCM or any other person. While such sources are believed to be reliable, TimesSquare does not assume any responsibility for the accuracy or completeness of such information. It does not undertake any obligation to update the information contained herein as of any future date.
Any indices and other financial benchmarks shown are provided for illustrative purposes only, are unmanaged, reflect reinvestment of income and dividends and do not reflect the impact of advisory fees. Investors cannot invest directly in an index. Comparisons to indexes have limitations because indexes have volatility and other material characteristics that may differ from a particular hedge fund. For example, a hedge fund may typically hold substantially fewer securities than are contained in an index.
Certain information contained herein constitutes “forward-looking statements,” which can be identified by the use of forward-looking terminology such as “may,” “will,” “should,” “expect,” “anticipate,” “project,” “estimate,” “intend,” “continue,” or “believe,” or the negatives thereof or other variations thereon or comparable terminology. Due to various risks and uncertainties, actual events, results or actual performance may differ materially from those reflected or contemplated in such forward-looking statements. Nothing contained herein may be relied upon as a guarantee, promise, assurance or a representation as to the future.
TimesSquare Capital Management, LLC
75 Rockefeller Plaza, 30th Floor, New York, NY 10019
©Copyright 2025 TimesSquare Capital Management, LLC. All rights reserved.
This document may not be reproduced, in whole or in part, without permission of the author.